We Have Finally Protected Proverbial Grandma!
As "RPEC 2023 Mortality Improvement Update" from Oct. 2023 clearly indicates. The devil is in the details, as always.
Please have a look at the Society of Actuaries Research Institute’s Retirement Plans Experience Committee latest report from Oct. 2023, optimistically titled “Mortality Improvement Update”:
It took long three years, but finally the excess mortality of 55+ is in the negative territory! Open the champaign!
Except, if you have a closer look, this miracle of the active pandemic measures has been achieved on the backs of the under 55, all the way since 2020, if you compare the “COVID-19” and “Exc. COVID-19” columns carefully. Also take into account that young people shot in the head were classified as “died from Covid” in 2020-2021, and that getting a Covid jab was rendering you impervious to any kind of death (as if). You see the pattern.
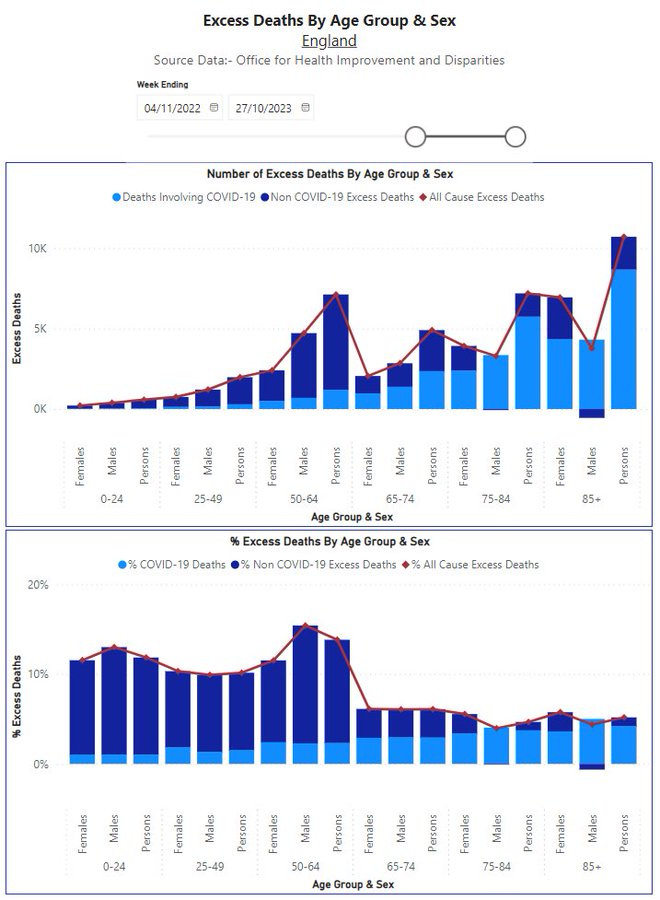
And as for the Public Health miraculous achievement, the negative mortality of the 55+ is just a pull forward effect - the most vulnerable in that age bracket have died out at an accelerated clip in the previous 3 years. That is also commonly coined as “culling the herd”. For their own sake, as it were.
This is not just an American phenomenon. The Brits achieved same result with their famed AstraZeneca jab (data from the UK Office for Disparities, I kid you not):
If you love statistics and didn’t have enough yet, here’s a post that will quench your thirst and then some: “Houston, The CDC Has a Problem (Part 2 of 3)” (The Ethical Sceptic, 2023.10.24).


This should be the conversation over Holiday dinner tables everywhere! Thanks Andreas, we need to help the jabbed to know what they can do to help themselves. They need to acknowledge the statistics if they are to have a chance. The other graphs within the report are vital to understanding.
One has to use Actuarial science. High death years are naturally followed by low death years because the vulnerable population has been depleted. I've seem this in NZ for the last 12 years. The winter of 2023 saw historically low deaths in the elderly following the cull of 2022. What we are seeing though, are high background deaths in the warmer months of 2023, suggesting something other than the flu is killing the elderly. I wonder what that could be? For example, the most recent weekly death total in NZ was for Nov 5. Historically this would be around 640 deaths but we recorded almost 740, unheard of for this time of year.